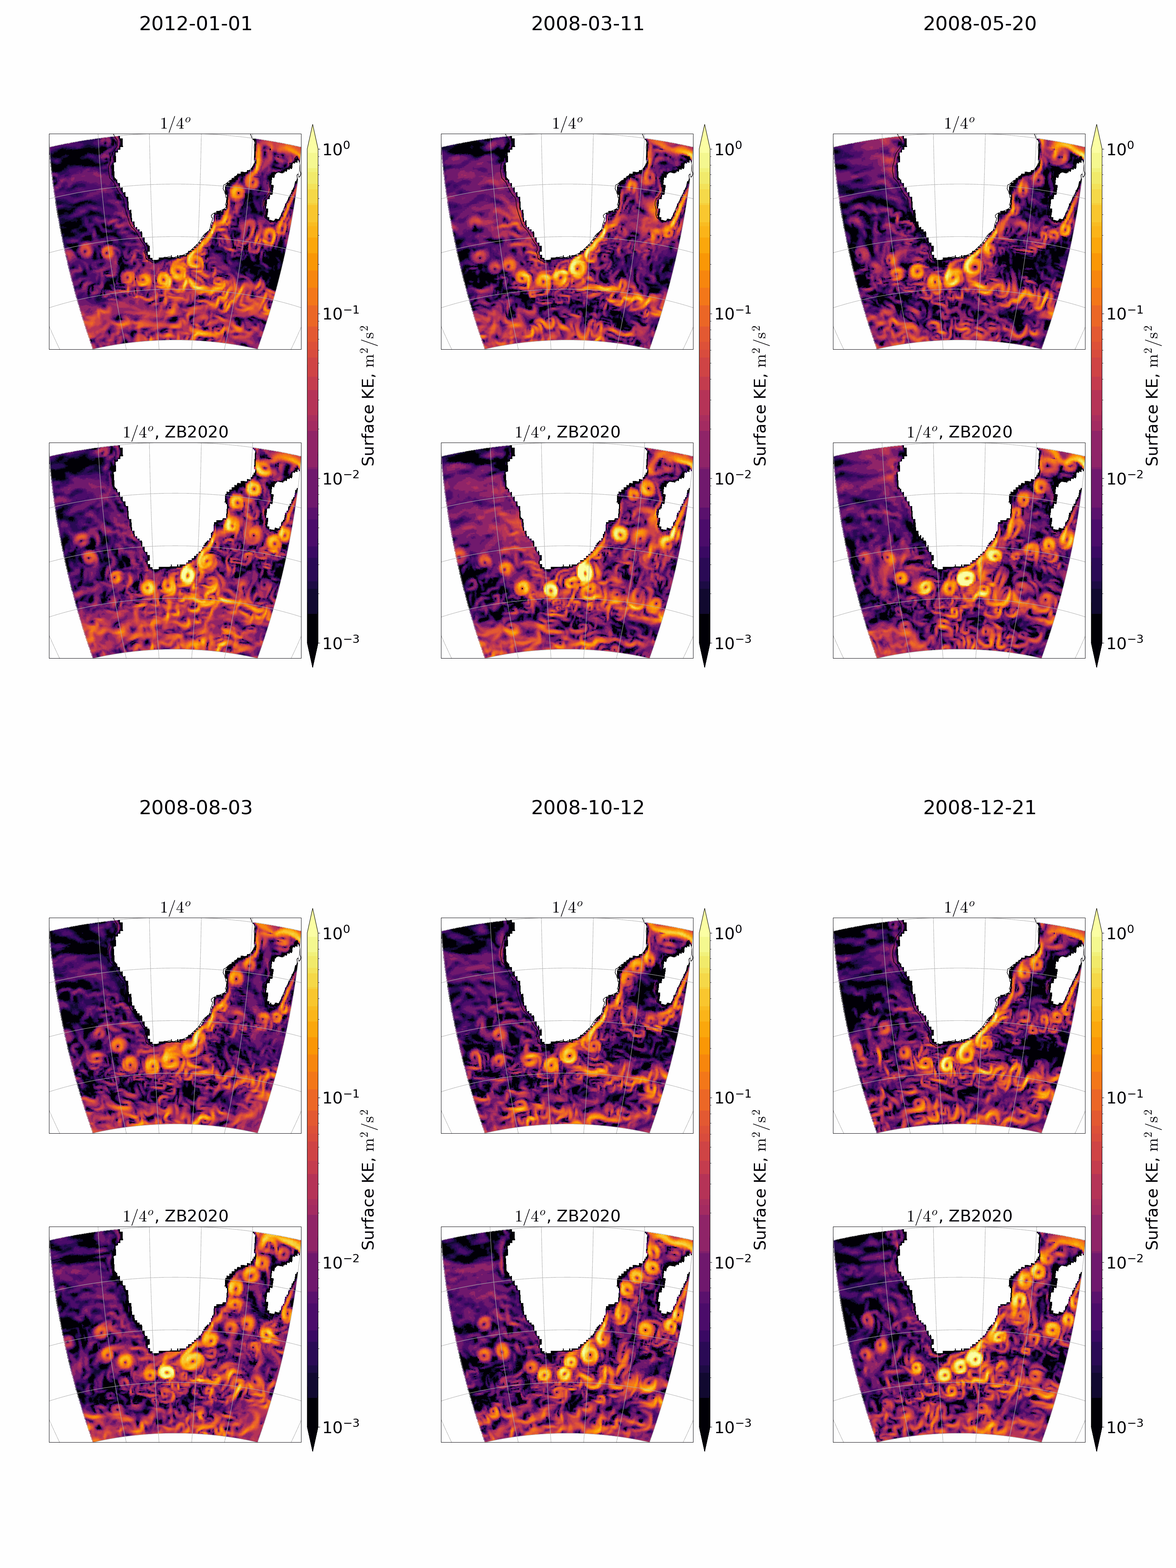
OM4 Animation#
To run this notebook, you will have to use LEAP-Pangeo hub!
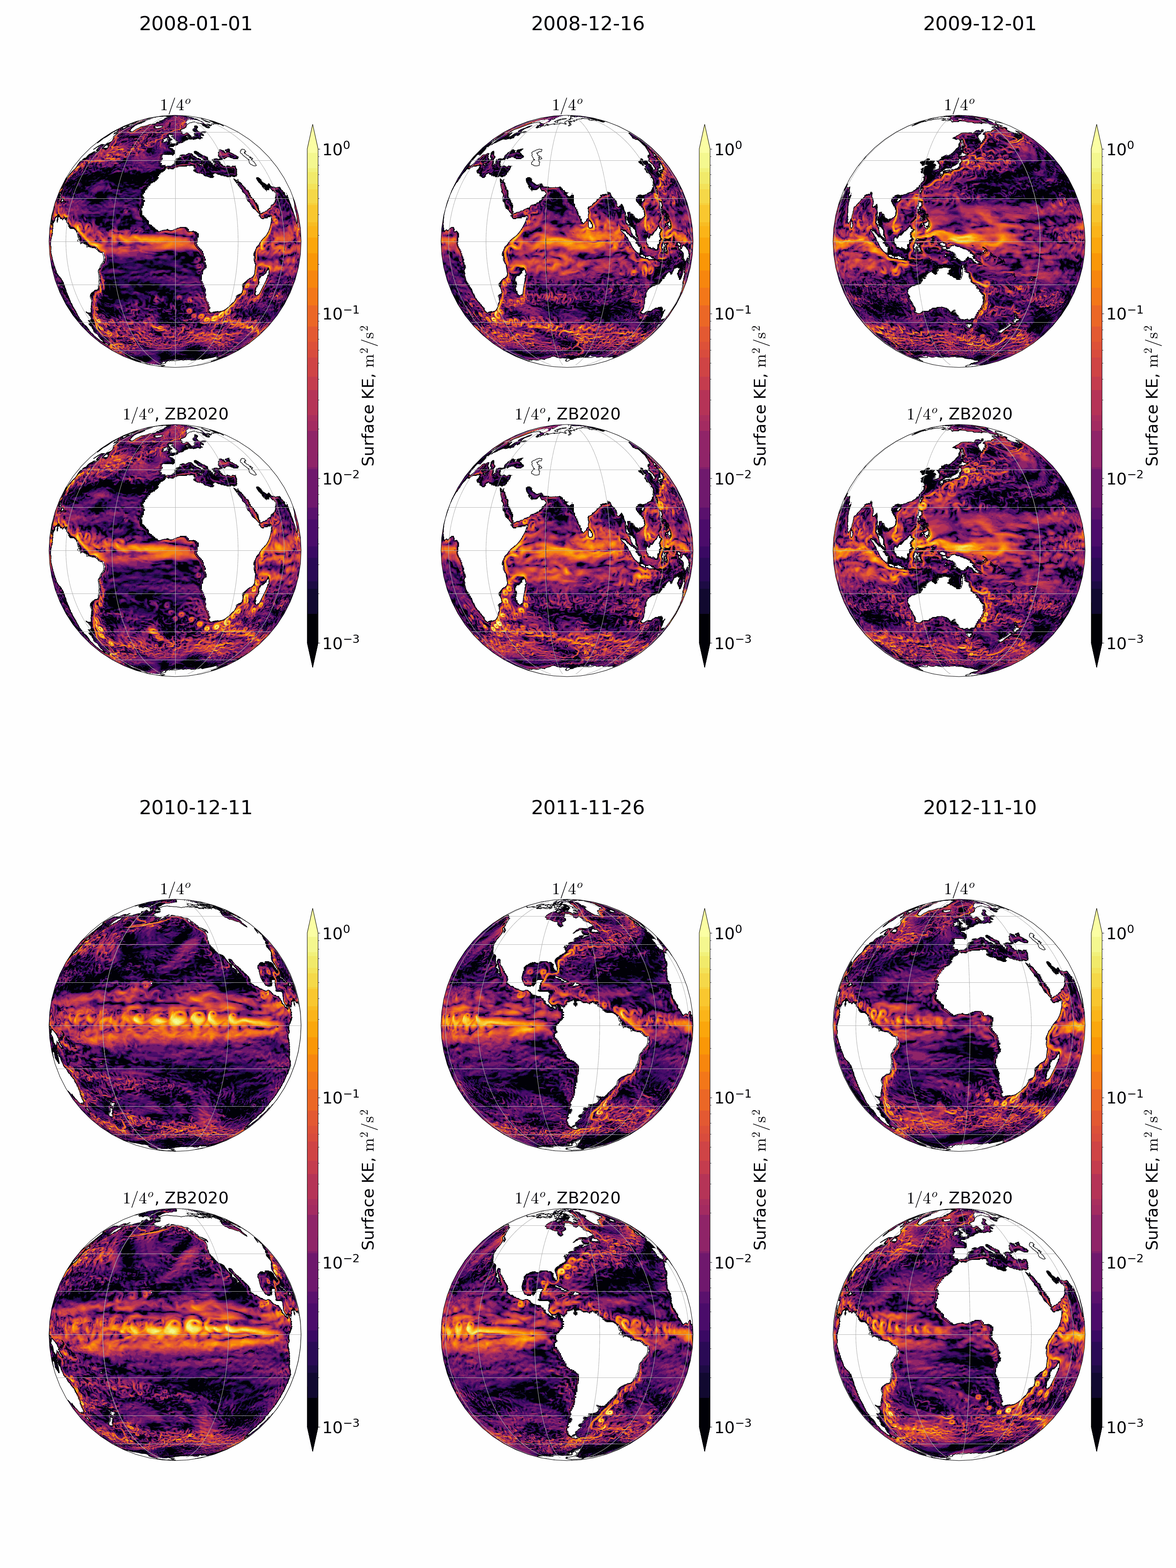
In this notebook, we will visualize the OM4 data using the xarray and matplotlib libraries and create an animation of the Surface Kinetic Energy over time. We will explore visualizations in both global and regional scales.
Credits: Pperezhogin/MOM6
import xarray as xr
import numpy as np
import matplotlib.pyplot as plt
from helpers.plot_helpers import *
from helpers.computational_tools import (
    remesh,
    gaussian_remesh,
    select_LatLon,
    Lk_error,
    x_coord,
    y_coord,
)
import os

%load_ext autoreload
%autoreload 2
import warnings

warnings.filterwarnings("ignore")
import hvplot.xarray
import holoviews as hv
import matplotlib as mpl
import cartopy.crs as ccrs

hvplot.output(widget_location="bottom")
path = "gs://leap-persistent/jbusecke/OM4_m2lines/daily_combined.zarr"
ds = xr.open_dataset(path, engine="zarr", chunks={})
ds
<xarray.Dataset>
Dimensions:       (yq: 1081, xq: 1441, yh: 1080, xh: 1440, experiment: 2,
                   time: 1827, nv: 2)
Coordinates: (12/34)
    Coriolis      (yq, xq) float32 dask.array<chunksize=(271, 361), meta=np.ndarray>
    areacello     (yh, xh) float32 dask.array<chunksize=(270, 360), meta=np.ndarray>
    areacello_bu  (yq, xq) float32 dask.array<chunksize=(271, 361), meta=np.ndarray>
    areacello_cu  (yh, xq) float32 dask.array<chunksize=(270, 361), meta=np.ndarray>
    areacello_cv  (yq, xh) float32 dask.array<chunksize=(271, 360), meta=np.ndarray>
    basin         (yh, xh) int32 dask.array<chunksize=(270, 360), meta=np.ndarray>
    ...            ...
    wet_u         (yh, xq) float32 dask.array<chunksize=(270, 361), meta=np.ndarray>
    wet_v         (yq, xh) float32 dask.array<chunksize=(271, 360), meta=np.ndarray>
  * xh            (xh) float64 -299.7 -299.5 -299.2 -299.0 ... 59.53 59.78 60.03
  * xq            (xq) float64 -299.8 -299.6 -299.3 -299.1 ... 59.66 59.91 60.16
  * yh            (yh) float64 -80.39 -80.31 -80.23 -80.15 ... 89.73 89.84 89.95
  * yq            (yq) float64 -80.43 -80.35 -80.27 -80.19 ... 89.78 89.89 90.0
Data variables:
    average_DT    (experiment, time) timedelta64[ns] dask.array<chunksize=(2, 1827), meta=np.ndarray>
    average_T1    (experiment, time) datetime64[ns] dask.array<chunksize=(2, 1827), meta=np.ndarray>
    average_T2    (experiment, time) datetime64[ns] dask.array<chunksize=(2, 1827), meta=np.ndarray>
    ssu           (experiment, time, yh, xq) float32 dask.array<chunksize=(1, 20, 1080, 1441), meta=np.ndarray>
    ssv           (experiment, time, yq, xh) float32 dask.array<chunksize=(1, 20, 1081, 1440), meta=np.ndarray>
    time_bnds     (experiment, time, nv) object dask.array<chunksize=(2, 1827, 2), meta=np.ndarray>
    tos           (experiment, time, yh, xh) float32 dask.array<chunksize=(1, 20, 1080, 1440), meta=np.ndarray>
    zos           (experiment, time, yh, xh) float32 dask.array<chunksize=(1, 20, 1080, 1440), meta=np.ndarray>
Attributes:
    associated_files:  areacello: 20080101.ocean_static.nc
    grid_tile:         N/A
    grid_type:         regular
title: OM4p25_bugfixes_JRA55do1.5_cycle1ZBu = ds["ssu"].sel(experiment="ZB2020")
ZBv = ds["ssv"].sel(experiment="ZB2020")
ZBT = ds["tos"].sel(experiment="ZB2020")
loresu = ds["ssu"].sel(experiment="unparameterized")
loresv = ds["ssv"].sel(experiment="unparameterized")
loresT = ds["tos"].sel(experiment="unparameterized")
def KE(u, v, T):
    return 0.5 * (remesh(u**2, T) + remesh(v**2, T))
ZBke = KE(ZBu, ZBv, ZBT)
loreske = KE(loresu, loresv, ZBT)
Global plotter#
import cartopy.crs as ccrs
import matplotlib as mpl

default_rcParams({"figure.subplot.hspace": 0.05, "font.size": 30})


def plot_global(i=0, fig=None, len_idx=None):
    if fig is None:
        fig = plt.figure(figsize=(7, 13))
    elif i != 0:
        print(f"Processing frame ({i//5}/{len_idx-1})")
    time_idx = i * 5
    time_str = loreske.time.isel(time=time_idx).item().strftime("%Y-%m-%d")

    ax1 = plt.subplot(211, projection=ccrs.Orthographic(central_longitude=i))
    ax1.coastlines(resolution="110m")
    ax1.gridlines()
    im = loreske.isel(time=time_idx).plot(
        ax=ax1,
        transform=ccrs.PlateCarree(),
        norm=mpl.colors.LogNorm(vmin=1e-3, vmax=1e0),
        cmap="inferno",
        add_colorbar=False,
    )
    ax1.set_title("$1/4^o$", fontsize=30)

    ax2 = plt.subplot(212, projection=ccrs.Orthographic(central_longitude=i))
    ax2.coastlines(resolution="110m")
    ax2.gridlines()
    im = ZBke.isel(time=time_idx).plot(
        ax=ax2,
        transform=ccrs.PlateCarree(),
        norm=mpl.colors.LogNorm(vmin=1e-3, vmax=1e0),
        cmap="inferno",
        add_colorbar=False,
    )
    ax2.set_title("$1/4^o$, ZB2020", fontsize=30)
    cb = plt.colorbar(im, pad=0.02, ax=[ax1, ax2], extend="both", aspect=50, shrink=0.9)
    cb.set_label(label="Surface KE, $\mathrm{m}^2/\mathrm{s}^2$", fontsize=30)
    plt.suptitle(time_str)
plot_global()
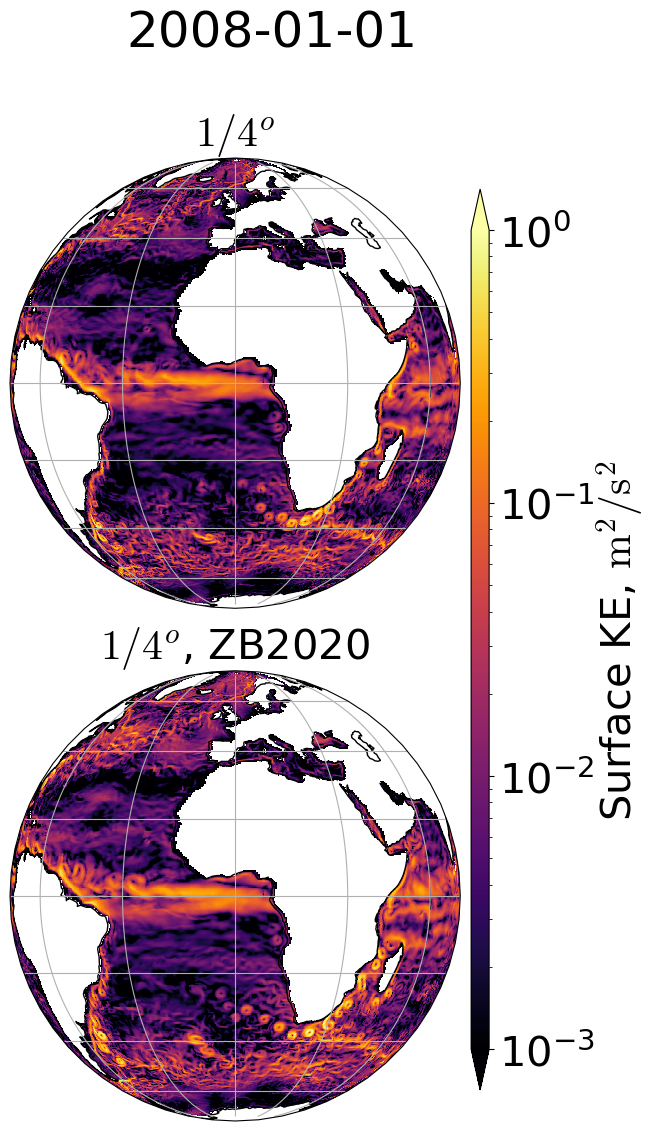
Here, we show the animation of the Surface Kinetic Energy in intervals of 5 days shifting the longitude by 5 degrees each step.
from matplotlib.animation import FuncAnimation, PillowWriter

def update_frame(i, plot_func, fig, len_idx):
    # Clear the current figure to prepare for the next frame's plot.
    plt.clf()
    plot_func(i, fig, len_idx)


def create_gif(plot_func, idx, filename="my-animation.gif", dpi=200, FPS=18, loop=0):
    fig = plt.figure(figsize=(10, 20))
    ani = FuncAnimation(
        fig,
        update_frame,
        frames=idx,
        fargs=(plot_func, fig, len(idx)),
        repeat=bool(loop),
        blit=False,
    )

    writer = PillowWriter(fps=FPS, metadata=dict(artist="Me"))
    ani.save(filename, writer=writer)
    plt.close(fig)
%%time
create_gif(
    plot_global, range(0, 360, 5), filename="./Global.gif", dpi=200, FPS=18, loop=0
)
Processing frame (1/71)
Processing frame (2/71)
Processing frame (3/71)
Processing frame (4/71)
Processing frame (5/71)
Processing frame (6/71)
Processing frame (7/71)
Processing frame (8/71)
Processing frame (9/71)
Processing frame (10/71)
Processing frame (11/71)
Processing frame (12/71)
Processing frame (13/71)
Processing frame (14/71)
Processing frame (15/71)
Processing frame (16/71)
Processing frame (17/71)
Processing frame (18/71)
Processing frame (19/71)
Processing frame (20/71)
Processing frame (21/71)
Processing frame (22/71)
Processing frame (23/71)
Processing frame (24/71)
Processing frame (25/71)
Processing frame (26/71)
Processing frame (27/71)
Processing frame (28/71)
Processing frame (29/71)
Processing frame (30/71)
Processing frame (31/71)
Processing frame (32/71)
Processing frame (33/71)
Processing frame (34/71)
Processing frame (35/71)
Processing frame (36/71)
Processing frame (37/71)
Processing frame (38/71)
Processing frame (39/71)
Processing frame (40/71)
Processing frame (41/71)
Processing frame (42/71)
Processing frame (43/71)
Processing frame (44/71)
Processing frame (45/71)
Processing frame (46/71)
Processing frame (47/71)
Processing frame (48/71)
Processing frame (49/71)
Processing frame (50/71)
Processing frame (51/71)
Processing frame (52/71)
Processing frame (53/71)
Processing frame (54/71)
Processing frame (55/71)
Processing frame (56/71)
Processing frame (57/71)
Processing frame (58/71)
Processing frame (59/71)
Processing frame (60/71)
Processing frame (61/71)
Processing frame (62/71)
Processing frame (63/71)
Processing frame (64/71)
Processing frame (65/71)
Processing frame (66/71)
Processing frame (67/71)
Processing frame (68/71)
Processing frame (69/71)
Processing frame (70/71)
Processing frame (71/71)
CPU times: user 15min 7s, sys: 3min 40s, total: 18min 48s
Wall time: 14min 29s
Saved Gif:
Regional plotter#
default_rcParams({"figure.subplot.hspace": 0.05, "font.size": 30})


def plot_regions(i=0, lat=slice(15, 70), lon=slice(-100, 0), fig=None, len_idx=None):
    if fig is None:
        fig = plt.figure(figsize=(7, 13))
    elif i != 1461:  # Start index for all regions
        i = i - 1461
        print(f"Processing frame ({i//5}/{len_idx-1})")
    time_idx = i
    time_str = loreske.time.isel(time=time_idx).item().strftime("%Y-%m-%d")

    ax1 = plt.subplot(
        211,
        projection=ccrs.Orthographic(
            central_latitude=(lat.start + lat.stop) / 2,
            central_longitude=(lon.start + lon.stop) / 2,
        ),
    )
    ax1.coastlines(resolution="110m")
    ax1.gridlines()
    im = (
        loreske.isel(time=time_idx)
        .sel(xh=lon, yh=lat)
        .plot(
            ax=ax1,
            transform=ccrs.PlateCarree(),
            norm=mpl.colors.LogNorm(vmin=1e-3, vmax=1e0),
            cmap="inferno",
            add_colorbar=False,
        )
    )
    ax1.set_title("$1/4^o$", fontsize=30)

    ax2 = plt.subplot(
        212,
        projection=ccrs.Orthographic(
            central_latitude=(lat.start + lat.stop) / 2,
            central_longitude=(lon.start + lon.stop) / 2,
        ),
    )
    # ax2.coastlines(resolution='110m')
    ax2.gridlines()
    im = (
        ZBke.isel(time=time_idx)
        .sel(xh=lon, yh=lat)
        .plot(
            ax=ax2,
            transform=ccrs.PlateCarree(),
            norm=mpl.colors.LogNorm(vmin=1e-3, vmax=1e0),
            cmap="inferno",
            add_colorbar=False,
        )
    )
    ax2.set_title("$1/4^o$, ZB2020", fontsize=30)
    cb = plt.colorbar(im, pad=0.02, ax=[ax1, ax2], extend="both", aspect=50, shrink=0.9)
    cb.set_label(label="Surface KE, $\mathrm{m}^2/\mathrm{s}^2$", fontsize=30)
    plt.suptitle(time_str)
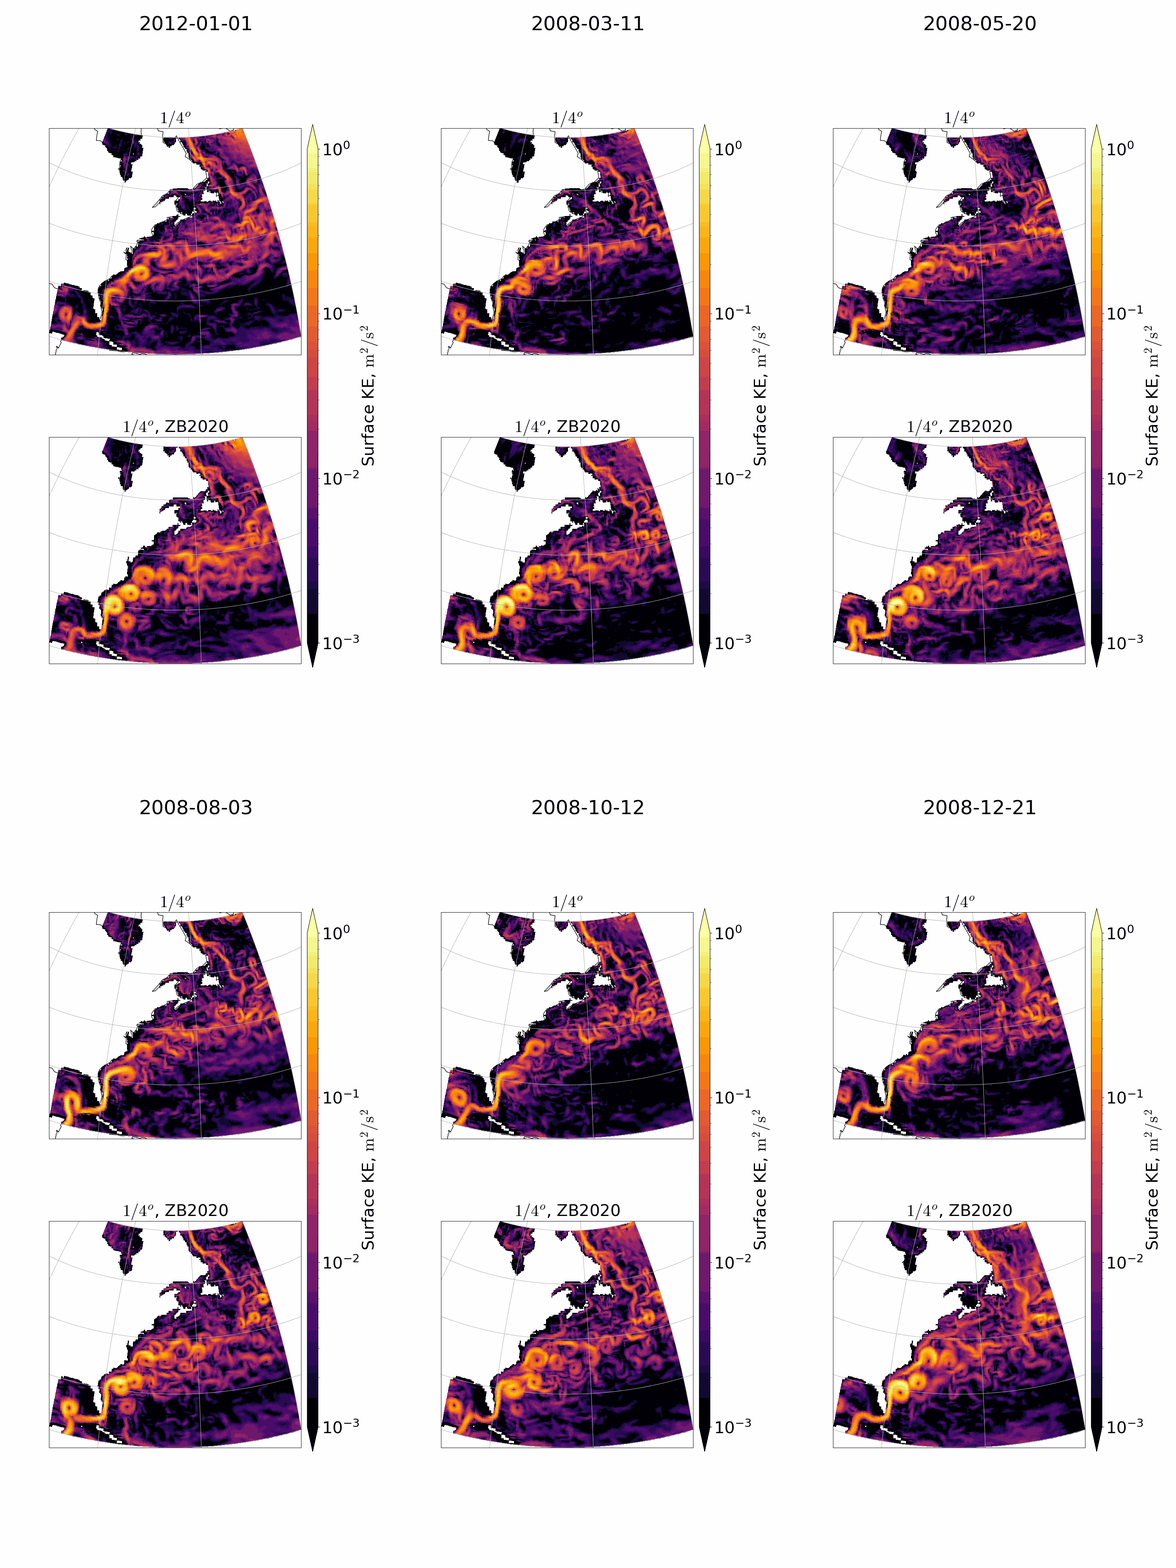
Plotting the Surface Kinetic Energy in the North Atlantic region.#
plot_Atlantic = lambda idx, fig, len_idx: plot_regions(
    i=idx, lat=slice(20, 60), lon=slice(-90, -40), fig=fig, len_idx=len_idx
)
plot_Atlantic(1461, None, None)
# plot_Atlantic(1826)
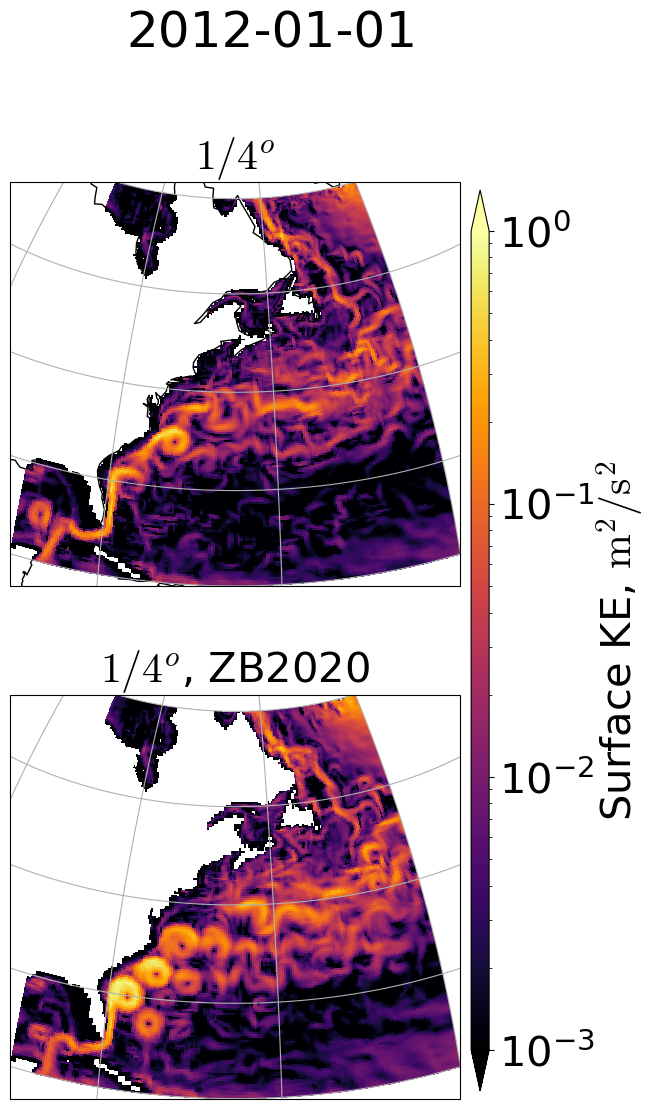
Saving the corresponding animation
%%time
create_gif(
    plot_Atlantic,
    range(1461, 1821, 5),
    filename="./Atlantic.gif",
    dpi=200,
    FPS=18,
    loop=0,
)
Processing frame (1/71)
Processing frame (2/71)
Processing frame (3/71)
Processing frame (4/71)
Processing frame (5/71)
Processing frame (6/71)
Processing frame (7/71)
Processing frame (8/71)
Processing frame (9/71)
Processing frame (10/71)
Processing frame (11/71)
Processing frame (12/71)
Processing frame (13/71)
Processing frame (14/71)
Processing frame (15/71)
Processing frame (16/71)
Processing frame (17/71)
Processing frame (18/71)
Processing frame (19/71)
Processing frame (20/71)
Processing frame (21/71)
Processing frame (22/71)
Processing frame (23/71)
Processing frame (24/71)
Processing frame (25/71)
Processing frame (26/71)
Processing frame (27/71)
Processing frame (28/71)
Processing frame (29/71)
Processing frame (30/71)
Processing frame (31/71)
Processing frame (32/71)
Processing frame (33/71)
Processing frame (34/71)
Processing frame (35/71)
Processing frame (36/71)
Processing frame (37/71)
Processing frame (38/71)
Processing frame (39/71)
Processing frame (40/71)
Processing frame (41/71)
Processing frame (42/71)
Processing frame (43/71)
Processing frame (44/71)
Processing frame (45/71)
Processing frame (46/71)
Processing frame (47/71)
Processing frame (48/71)
Processing frame (49/71)
Processing frame (50/71)
Processing frame (51/71)
Processing frame (52/71)
Processing frame (53/71)
Processing frame (54/71)
Processing frame (55/71)
Processing frame (56/71)
Processing frame (57/71)
Processing frame (58/71)
Processing frame (59/71)
Processing frame (60/71)
Processing frame (61/71)
Processing frame (62/71)
Processing frame (63/71)
Processing frame (64/71)
Processing frame (65/71)
Processing frame (66/71)
Processing frame (67/71)
Processing frame (68/71)
Processing frame (69/71)
Processing frame (70/71)
Processing frame (71/71)
CPU times: user 10min 15s, sys: 3min 37s, total: 13min 52s
Wall time: 9min 13s
Saved Gif:
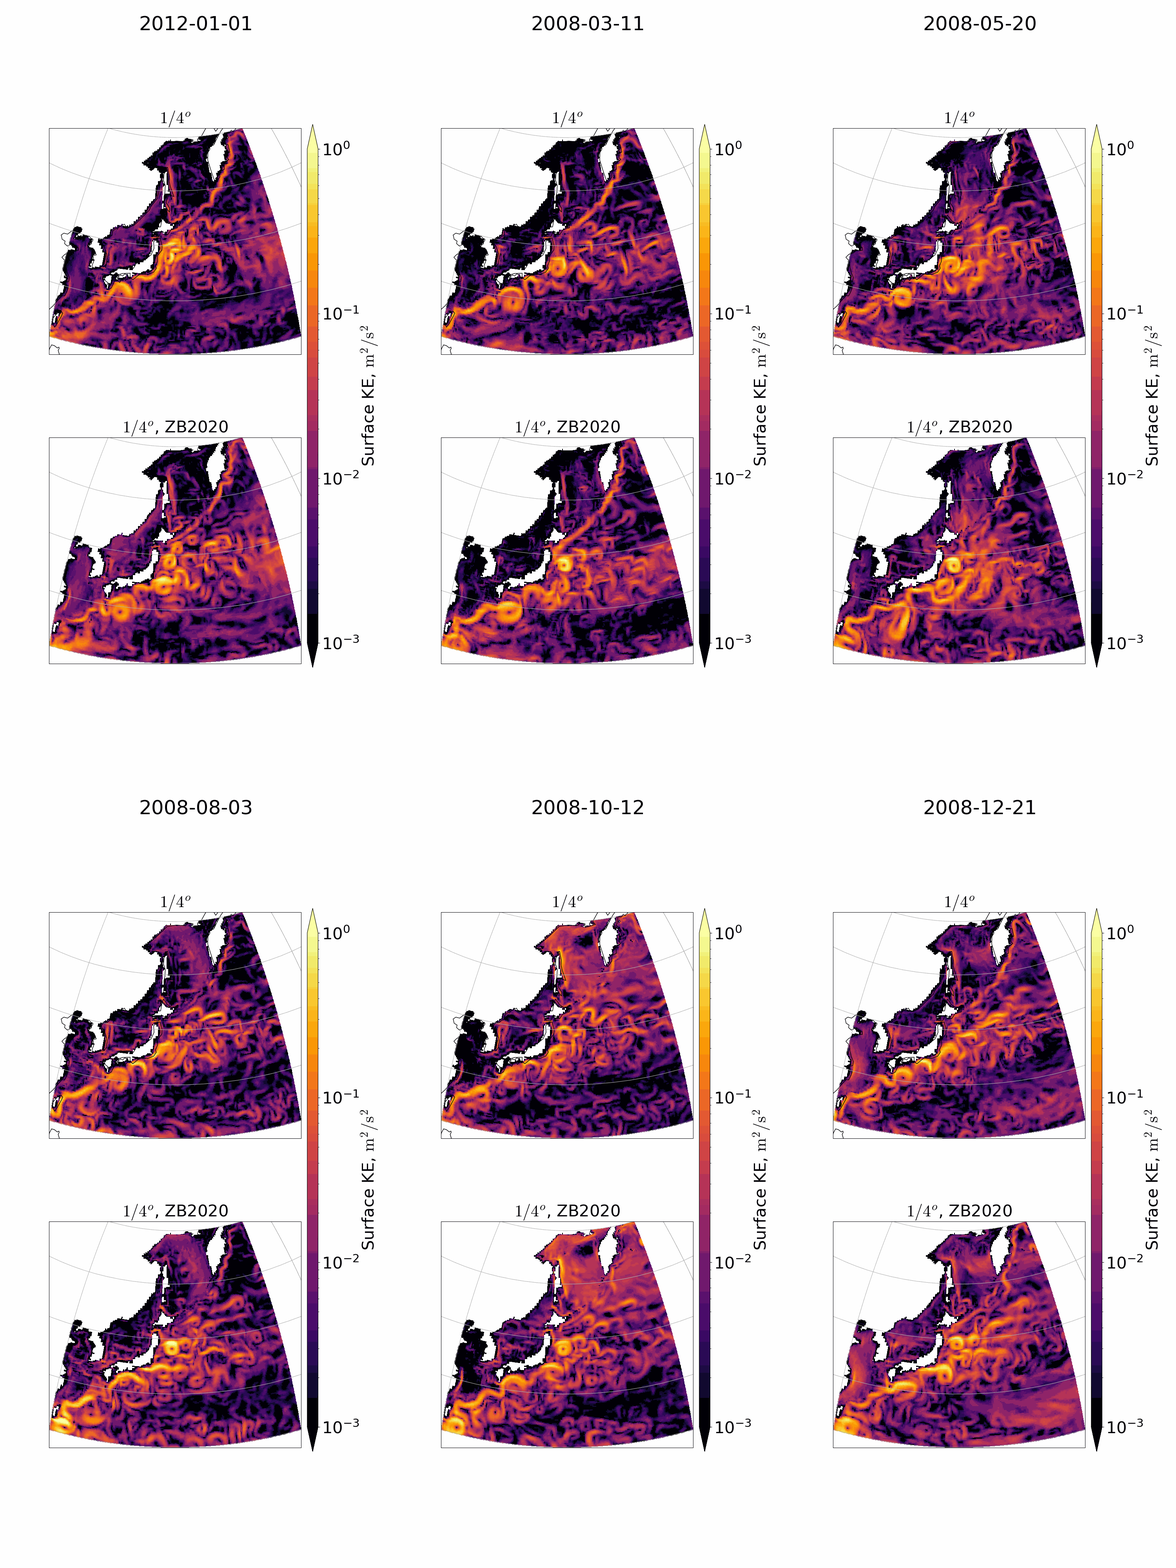
Plotting the Surface Kinetic Energy in the Pacific region.#
plot_Pacific = lambda idx, fig, len_idx: plot_regions(
    i=idx, lat=slice(20, 60), lon=slice(-240, -190), fig=fig, len_idx=len_idx
)
plot_Pacific(-1, None, None)
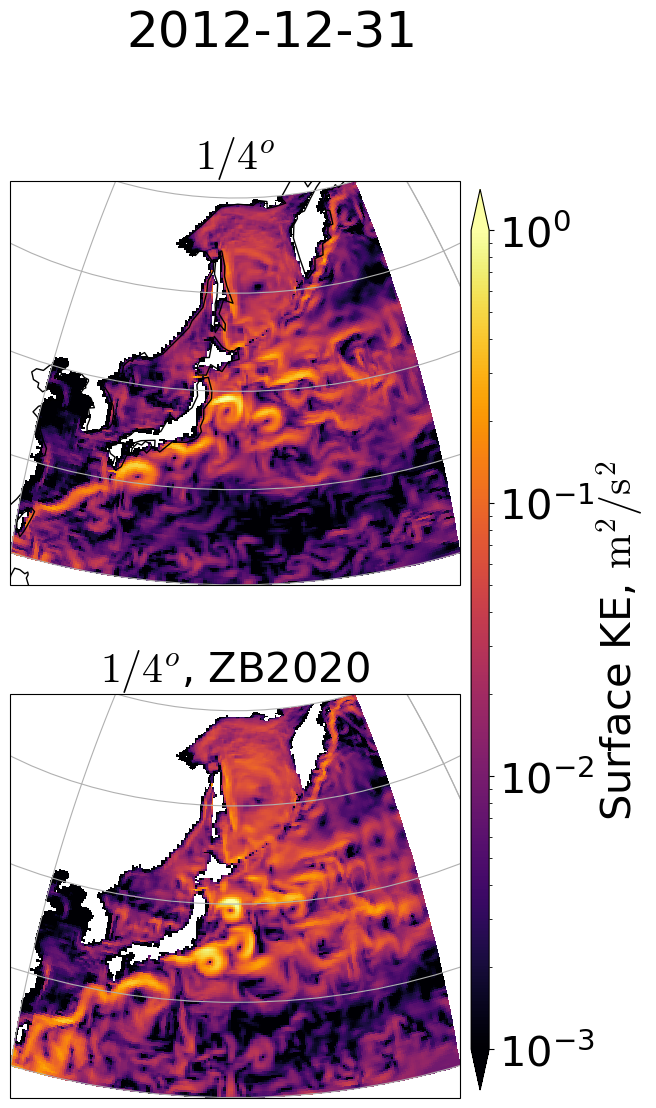
Saving the corresponding animation
%%time
create_gif(
    plot_Pacific,
    range(1461, 1821, 5),
    filename="./Pacific.gif",
    dpi=200,
    FPS=18,
    loop=0,
)
Processing frame (1/71)
Processing frame (2/71)
Processing frame (3/71)
Processing frame (4/71)
Processing frame (5/71)
Processing frame (6/71)
Processing frame (7/71)
Processing frame (8/71)
Processing frame (9/71)
Processing frame (10/71)
Processing frame (11/71)
Processing frame (12/71)
Processing frame (13/71)
Processing frame (14/71)
Processing frame (15/71)
Processing frame (16/71)
Processing frame (17/71)
Processing frame (18/71)
Processing frame (19/71)
Processing frame (20/71)
Processing frame (21/71)
Processing frame (22/71)
Processing frame (23/71)
Processing frame (24/71)
Processing frame (25/71)
Processing frame (26/71)
Processing frame (27/71)
Processing frame (28/71)
Processing frame (29/71)
Processing frame (30/71)
Processing frame (31/71)
Processing frame (32/71)
Processing frame (33/71)
Processing frame (34/71)
Processing frame (35/71)
Processing frame (36/71)
Processing frame (37/71)
Processing frame (38/71)
Processing frame (39/71)
Processing frame (40/71)
Processing frame (41/71)
Processing frame (42/71)
Processing frame (43/71)
Processing frame (44/71)
Processing frame (45/71)
Processing frame (46/71)
Processing frame (47/71)
Processing frame (48/71)
Processing frame (49/71)
Processing frame (50/71)
Processing frame (51/71)
Processing frame (52/71)
Processing frame (53/71)
Processing frame (54/71)
Processing frame (55/71)
Processing frame (56/71)
Processing frame (57/71)
Processing frame (58/71)
Processing frame (59/71)
Processing frame (60/71)
Processing frame (61/71)
Processing frame (62/71)
Processing frame (63/71)
Processing frame (64/71)
Processing frame (65/71)
Processing frame (66/71)
Processing frame (67/71)
Processing frame (68/71)
Processing frame (69/71)
Processing frame (70/71)
Processing frame (71/71)
CPU times: user 10min 14s, sys: 3min 28s, total: 13min 42s
Wall time: 9min
Saved Gif:
Plotting the Surface Kinetic Energy in the Aghulas region#
plot_Aghulas = lambda idx, fig, len_idx: plot_regions(
    i=idx, lat=slice(-50, -10), lon=slice(0, 50), fig=fig, len_idx=len_idx
)
plot_Aghulas(-1, None, None)
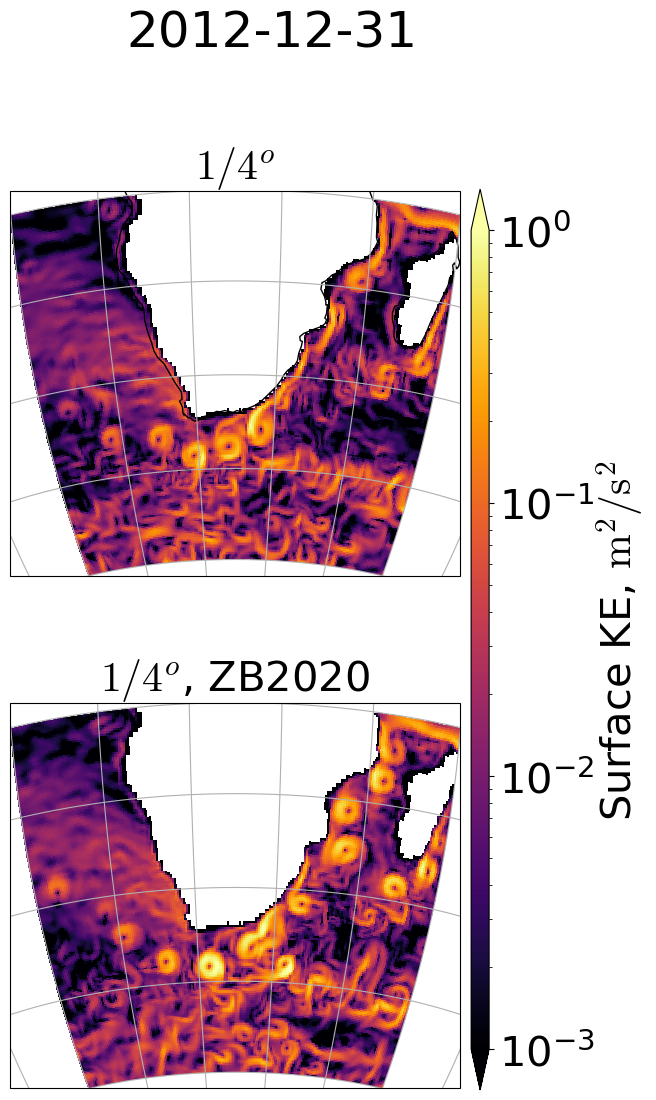
Saving the corresponding animation
%%time
create_gif(
    plot_Aghulas,
    range(1461, 1821, 5),
    filename="./Aghulas.gif",
    dpi=200,
    FPS=18,
    loop=0,
)
Processing frame (1/71)
Processing frame (2/71)
Processing frame (3/71)
Processing frame (4/71)
Processing frame (5/71)
Processing frame (6/71)
Processing frame (7/71)
Processing frame (8/71)
Processing frame (9/71)
Processing frame (10/71)
Processing frame (11/71)
Processing frame (12/71)
Processing frame (13/71)
Processing frame (14/71)
Processing frame (15/71)
Processing frame (16/71)
Processing frame (17/71)
Processing frame (18/71)
Processing frame (19/71)
Processing frame (20/71)
Processing frame (21/71)
Processing frame (22/71)
Processing frame (23/71)
Processing frame (24/71)
Processing frame (25/71)
Processing frame (26/71)
Processing frame (27/71)
Processing frame (28/71)
Processing frame (29/71)
Processing frame (30/71)
Processing frame (31/71)
Processing frame (32/71)
Processing frame (33/71)
Processing frame (34/71)
Processing frame (35/71)
Processing frame (36/71)
Processing frame (37/71)
Processing frame (38/71)
Processing frame (39/71)
Processing frame (40/71)
Processing frame (41/71)
Processing frame (42/71)
Processing frame (43/71)
Processing frame (44/71)
Processing frame (45/71)
Processing frame (46/71)
Processing frame (47/71)
Processing frame (48/71)
Processing frame (49/71)
Processing frame (50/71)
Processing frame (51/71)
Processing frame (52/71)
Processing frame (53/71)
Processing frame (54/71)
Processing frame (55/71)
Processing frame (56/71)
Processing frame (57/71)
Processing frame (58/71)
Processing frame (59/71)
Processing frame (60/71)
Processing frame (61/71)
Processing frame (62/71)
Processing frame (63/71)
Processing frame (64/71)
Processing frame (65/71)
Processing frame (66/71)
Processing frame (67/71)
Processing frame (68/71)
Processing frame (69/71)
Processing frame (70/71)
Processing frame (71/71)
CPU times: user 10min 8s, sys: 3min 26s, total: 13min 34s
Wall time: 8min 57s
Saved Gif:
