Introduction to Xarray#
Before we get started, you may choose to run this notebook on LEAP-Pangeo hub or Binder!
Xarray is an open source Python package designed to work with lablled multidimensional arrays in an efficient manner. By multidimensional data (also often called N-dimensional), we mean data with many independent dimensions or axes. For example, we might represent Earth’s surface temperature \(T\) as a three dimensional variable:
where \(x\) and \(y\) are spatial dimensions and \(t\) is time. By labeled, we mean data that has metadata associated with it describing the names and relationships between the variables.
Example of multidimensional data processing using Xarray:
!wget -O ./dataset.nc https://github.com/pangeo-data/tutorial-data/raw/master/sst/NOAA_NCDC_ERSST_v3b_SST-1960.nc
--2024-11-14 15:13:32--  https://github.com/pangeo-data/tutorial-data/raw/master/sst/NOAA_NCDC_ERSST_v3b_SST-1960.nc
Resolving github.com (github.com)... 140.82.113.3
Connecting to github.com (github.com)|140.82.113.3|:443... connected.
HTTP request sent, awaiting response... 302 Found
Location: https://raw.githubusercontent.com/pangeo-data/tutorial-data/master/sst/NOAA_NCDC_ERSST_v3b_SST-1960.nc [following]
--2024-11-14 15:13:33--  https://raw.githubusercontent.com/pangeo-data/tutorial-data/master/sst/NOAA_NCDC_ERSST_v3b_SST-1960.nc
Resolving raw.githubusercontent.com (raw.githubusercontent.com)... 185.199.109.133, 185.199.111.133, 185.199.110.133, ...
Connecting to raw.githubusercontent.com (raw.githubusercontent.com)|185.199.109.133|:443... connected.
HTTP request sent, awaiting response... 200 OK
Length: 785127 (767K) [application/octet-stream]
Saving to: ‘./dataset.nc’

./dataset.nc        100%[===================>] 766.73K  --.-KB/s    in 0.008s

2024-11-14 15:13:33 (98.4 MB/s) - ‘./dataset.nc’ saved [785127/785127]
import xarray as xr

ds = xr.open_dataset("dataset.nc")
ds
<xarray.Dataset>
Dimensions:  (lat: 89, lon: 180, time: 12)
Coordinates:
  * lat      (lat) float32 -88.0 -86.0 -84.0 -82.0 -80.0 ... 82.0 84.0 86.0 88.0
  * lon      (lon) float32 0.0 2.0 4.0 6.0 8.0 ... 350.0 352.0 354.0 356.0 358.0
  * time     (time) datetime64[ns] 1960-01-15 1960-02-15 ... 1960-12-15
Data variables:
    sst      (time, lat, lon) float32 ...
Attributes:
    Conventions:  IRIDL
    source:       https://iridl.ldeo.columbia.edu/SOURCES/.NOAA/.NCDC/.ERSST/...
history: extracted and cleaned by Ryan Abernathey for Research Compu...Data Structures#
Like Pandas, xarray has two fundamental data structures: a DataArray, which holds a single multi-dimensional variable and its coordinates a Dataset, which holds multiple variables that potentially share the same coordinates
A DataArray has four essential attributes: * values: a numpy.ndarray holding the array’s values dims: dimension names for each axis (e.g., ('x', 'y', 'z')), coords: a dict-like container of arrays (coordinates) that label each point (e.g., 1-dimensional arrays of numbers, datetime objects or strings) attrs: an OrderedDict to hold arbitrary metadata (attributes)
A dataset is simply an object containing multiple DataArrays indexed by variable name.
xr.set_options(display_style="html")
ds
<xarray.Dataset>
Dimensions:  (lat: 89, lon: 180, time: 12)
Coordinates:
  * lat      (lat) float32 -88.0 -86.0 -84.0 -82.0 -80.0 ... 82.0 84.0 86.0 88.0
  * lon      (lon) float32 0.0 2.0 4.0 6.0 8.0 ... 350.0 352.0 354.0 356.0 358.0
  * time     (time) datetime64[ns] 1960-01-15 1960-02-15 ... 1960-12-15
Data variables:
    sst      (time, lat, lon) float32 ...
Attributes:
    Conventions:  IRIDL
    source:       https://iridl.ldeo.columbia.edu/SOURCES/.NOAA/.NCDC/.ERSST/...
history: extracted and cleaned by Ryan Abernathey for Research Compu...# attribute syntax
sst = ds.sst # or sst = ds['sst']
sst
<xarray.DataArray 'sst' (time: 12, lat: 89, lon: 180)>
[192240 values with dtype=float32]
Coordinates:
  * lat      (lat) float32 -88.0 -86.0 -84.0 -82.0 -80.0 ... 82.0 84.0 86.0 88.0
  * lon      (lon) float32 0.0 2.0 4.0 6.0 8.0 ... 350.0 352.0 354.0 356.0 358.0
  * time     (time) datetime64[ns] 1960-01-15 1960-02-15 ... 1960-12-15
Attributes:
    pointwidth:          1.0
    valid_min:           -3.0
    valid_max:           45.0
    units:               degree_Celsius
    long_name:           Extended reconstructed sea surface temperature
    standard_name:       sea_surface_temperature
iridl:hasSemantics: iridl:SeaSurfaceTemperatureIndexing#
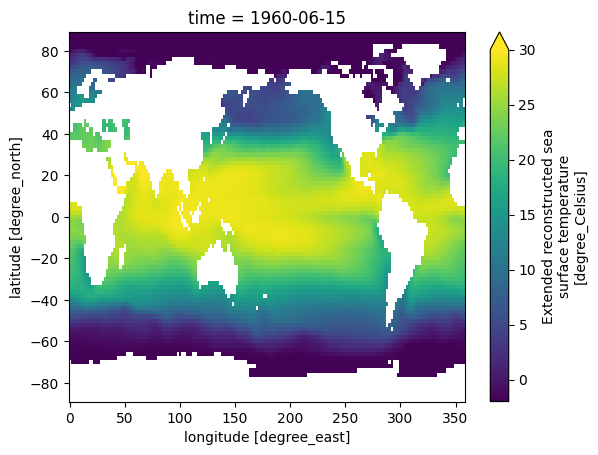
sst.sel(time="1960-06-15").plot(vmin=-2, vmax=30);

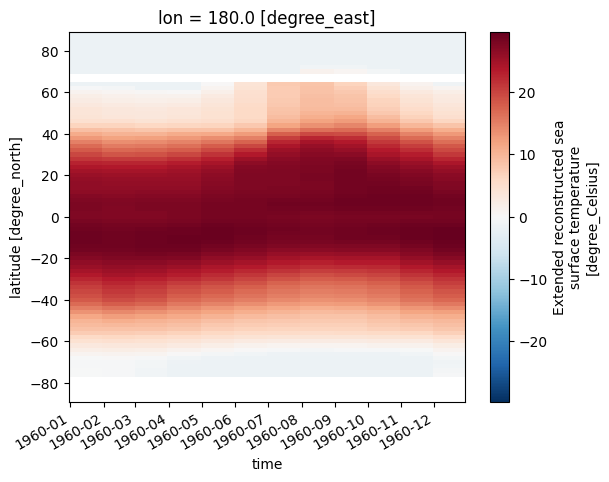
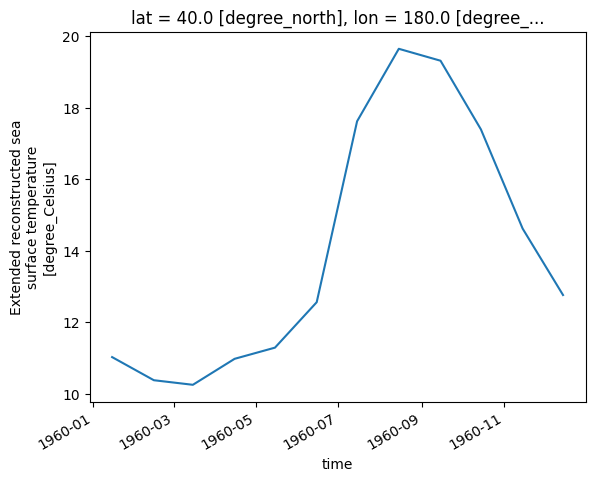
We can select along any axis
sst.sel(lon=180).transpose().plot();

sst.sel(lon=180, lat=40).plot();

