Pycnocline Depth using MOM6#
Before we get started, you may choose to run this notebook on LEAP-Pangeo hub or Binder!
In this tutorial, we demonstrate how to calculate the zonal-average pycnocline depth in MOM6 data using xarray and xgcm modules. The codebase is inspired by Dr. Emily Newsom’s work in https://agupubs.onlinelibrary.wiley.com/doi/full/10.1029/2023GL105673.
import numpy as np
import pandas as pd
import xarray as xr
import gsw as gs
from matplotlib import pyplot as plt
from xgcm import Grid

xr.set_options(display_style="html")
plt.rcParams["figure.figsize"] = 5, 2.5
Load Data File#
data_dir = "./data/"
file_t = "thetao_ePBL_data_timemean_1978-2002.nc"
file_s = "so_ePBL_data_timemean_1978-2002.nc"
file_n2 = "N2_ePBL_data_timemean_1978-2002.nc"  # we load this only to use the z_i grid in a later step
basin_file = "ocean_static_rm2.nc"
dt = xr.open_dataset(data_dir + file_t)
ds = xr.open_dataset(data_dir + file_s)
dn2 = xr.open_dataset(data_dir + file_n2)
db = xr.open_dataset(data_dir + basin_file)
Load temperature and salinity#
temperature = dt["thetao"].squeeze("time")
salinity = ds["so"].squeeze("time")
basins = db["basin"]
Calculate potential density relative to pressure:#
We calculate potential density relative to pressure \(p\) from Absolute Salinty (\(SA\)) and Conservative Temperature (\(CT\)). The results are pretty insensitive to reference pressure. Here we use \(p=0\) because it’s slightly smoother than using \(\sigma_2\) (for \(\sigma_2\), use, \(p=2000\), PD = gs.density.sigma2(SA,CT))
p = 0
SA = gs.SA_from_SP(salinity, p, salinity.lon, salinity.lat)
CT = gs.CT_from_t(SA, temperature, p)
PD = gs.density.sigma0(SA, CT)
Calculate \(\overline{\rho}_{norm}\) from \(\rho^*\):#
We calculate \(\overline{\rho}_{norm}\) from \(\rho^*\), the zonally-averaged potential density below the surface gyres.
lat = -45
ml_depth = 350

pd_no_med = PD.where(basins < 6)  # mask out med and marginal seas

rho_norm = -(pd_no_med.mean("lon") - pd_no_med.mean("lon").max("z_l"))
rho_norm = rho_norm.where(
    rho_norm
    < rho_norm.sel(z_l=ml_depth, method="nearest").sel(lat=lat, method="nearest")
)
rho_norm = rho_norm / rho_norm.max("z_l")
rho_norm = rho_norm.rename("rho_norm")
Plot \(\overline{\rho_{norm}}(y,z)\) (left) and depth of the pycnocline (\(\overline{\rho_{norm}}=1/e)\) overlaid on zonal average potential density (\(\overline{\rho}(y,z)\)) (right)
levels1 = np.arange(0, 1, 0.1)
levels2 = np.arange(25.2, 28, 0.2)

fig, axs = plt.subplots(1, 2, figsize=(10, 2.5))

rn = rho_norm.plot.contourf(levels=levels1, add_colorbar=False, ax=axs[0])
cbar1 = plt.colorbar(rn, ax=axs[0])

pd = (
    pd_no_med.mean("lon")
    .rename("potential_density")
    .plot.contourf(levels=levels2, vmin=25, vmax=28.3, add_colorbar=False, ax=axs[1])
)
rho_norm.rolling(lat=5).mean().plot.contour(
    levels=[1 / np.exp(1)], colors="k", linestyles="-", linewidths=3, ax=axs[1]
)
rho_norm.plot.contour(
    levels=[1 / np.exp(1)], colors="coral", linestyles="--", linewidths=2, ax=axs[1]
)
cbar2 = plt.colorbar(pd, ax=axs[1])

for j in range(0, 2):
    axs[j].set_ylim(3000, 0)
    axs[j].set_xlim(-65, 60)
    axs[j].set_xlabel("latitude")
    axs[j].set_title("")


axs[0].set_ylabel("depth (m)")
axs[1].set_ylabel("")
cbar1.set_label(r"$\overline{\rho_{norm}}$")
cbar2.set_label(r"$\overline{\rho}$ (kg/m$^3$)")

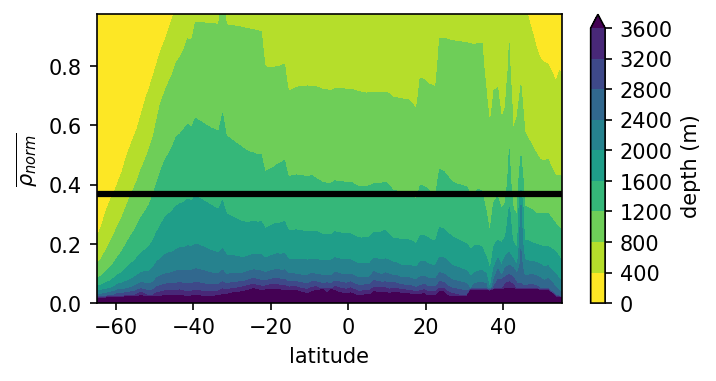
Transform \(\rho_{norm}(y,z)\) to \(z(y,\rho_{norm})\)#
The point of doing this is to calculate the average depth, \(z\) of a given \(\rho_{norm}\) surface, such as \(\rho_{norm} =1/e\), i.e., the pycnocline depth by our definition. We do this by applying XGCM Grid transforms.
lat = ds.lat.values
z_l = ds.z_l.values
z_i = dn2.z_i[1:].values

ds_rn = xr.Dataset(
    coords={
        "lat_c": (
            ["lat_c"],
            lat,
        ),
        "lat_g": (
            ["lat_g"],
            lat + 0.5,
        ),
        "z_l": (
            ["z_l"],
            z_l,
        ),
        "z_i": (["z_i"], z_i),
    }
)
grid = Grid(
    ds_rn,
    coords={
        "Y": {"center": "lat_c", "right": "lat_g"},
        "Z": {"inner": "z_l", "outer": "z_i"},
    },
    periodic=False,
)
lev_grid = rho_norm.z_l.broadcast_like(rho_norm)
target_levels = np.arange(0, 1, 0.025)
depth_rho_norm = grid.transform(
    lev_grid, "Z", target_levels, target_data=rho_norm, method="linear"
)
Plot in Normalized Density - Latitude Space
plt.figure(dpi=150)
d = (depth_rho_norm).plot.contourf(
    levels=np.arange(0, 4000, 400), y="rho_norm", cmap="viridis_r", add_colorbar=False
)
plt.hlines(1 / np.exp(1), -70, 60, colors="k", linewidths=3)
plt.ylabel(r"$\overline{\rho_{norm}}$")
plt.xlabel("latitude")
plt.xlim(-65, 55)
cbar = plt.colorbar(d)
cbar.set_label("depth (m)")
plt.title("");

Calculate Average between 60S to 60N#
lats = slice(-60, 60)
pyc_depth = (
    depth_rho_norm.sel(rho_norm=1 / np.exp(1), method="nearest")
    .sel(lat=lats)
    .mean("lat")
)
print("Average pycnocline depth: " + str(np.round(pyc_depth.values)) + " meters")
Average pycnocline depth: 1221.0 meters
Conclusion#
In this notebook, we demonstrate how to load NetCDF files of MOM6 and then using xarray, xgcm and the work of Dr. Emily Newsom, we are able to extract the pycnocline depth.
